Agencies search for a GTmetrix alternative when the problem is no longer “is this URL slow right now?” but “which of our forty client sites got worse after last week’s deploys?” One-off diagnostics still matter. They stop being enough when the work is a portfolio.
What GTmetrix does well
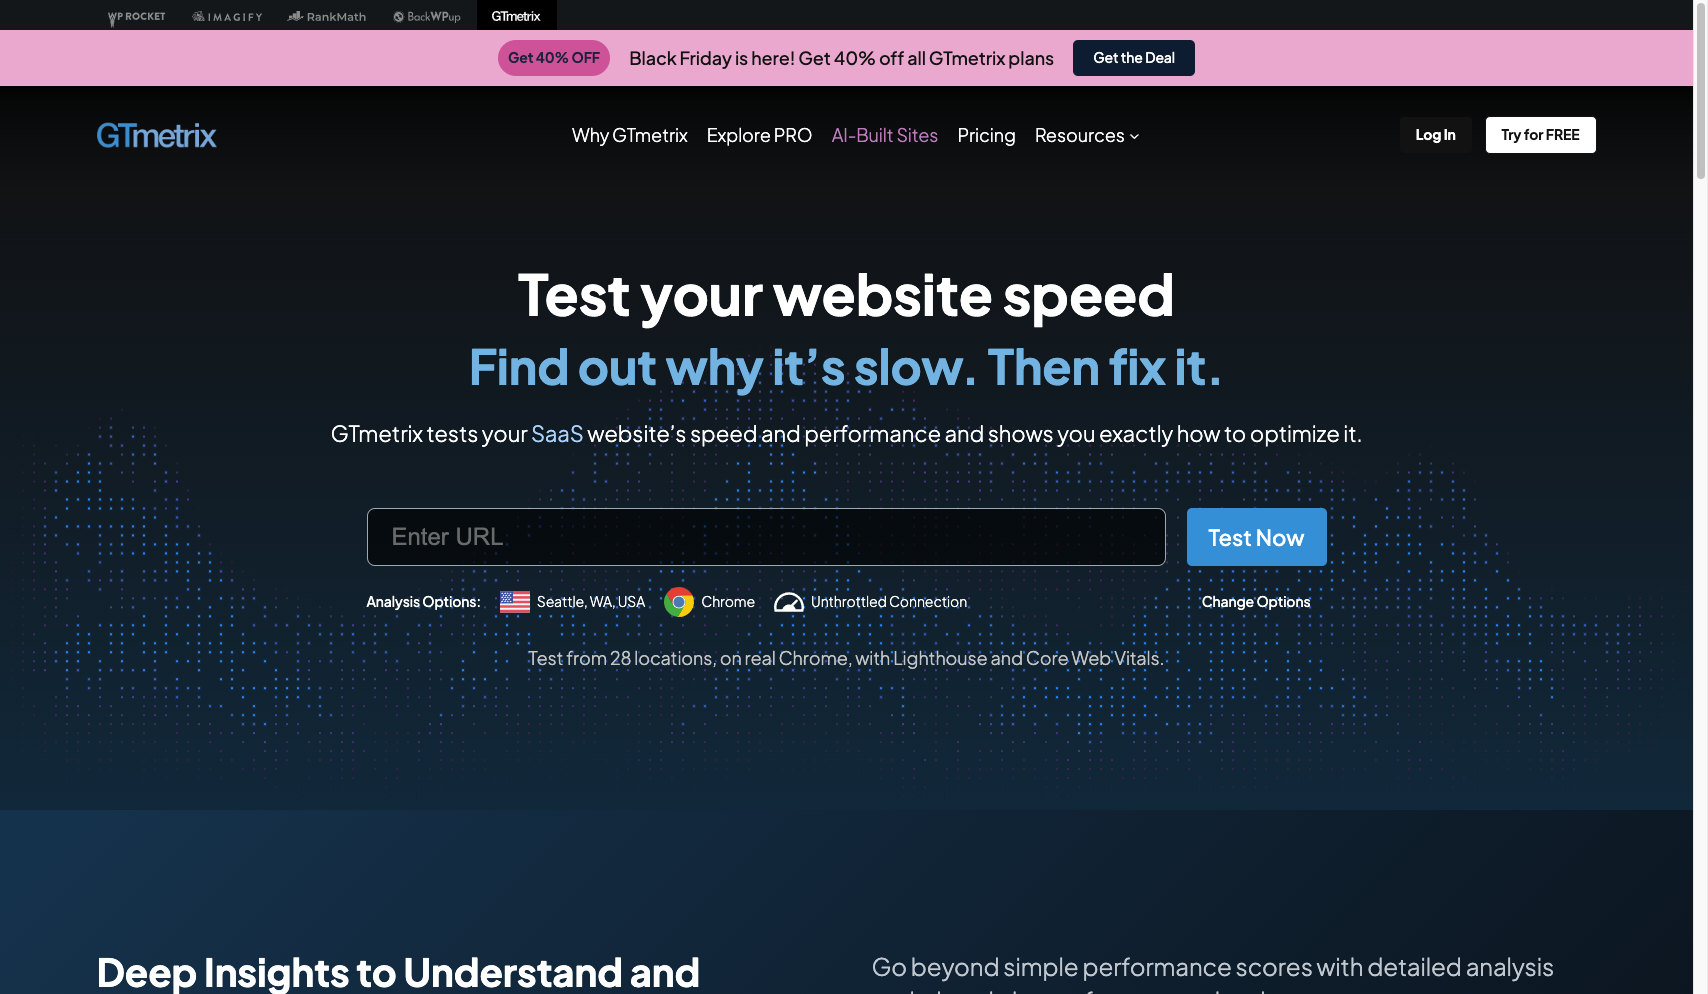
GTmetrix runs real Chrome against a URL, shows a waterfall you can argue about in a ticket, and offers many test locations when geography is part of the story. For a launch day, a stubborn LCP on a product template, or a “prove it from Frankfurt” request, that workflow is honest and familiar. Plenty of freelancers and in-house teams will keep it in the kit for exactly those jobs.
The friction appears when the same person is asked to watch twenty sites every week by hand. Manual URL lists drift. Screenshots age. Nobody remembers which homepage was green last Tuesday. The tool did not fail; the operating model did.
What a monitoring alternative actually changes
A GTmetrix alternative aimed at agencies is not “the same waterfall with a different logo.” It is a different job: scheduled lab runs (and field signals when CrUX is available), organisations so clients do not share one flat inbox, automated discovery so onboarding is not a paste marathon, and reports you can send without rebuilding the narrative from scratch each month.
Apogee Watcher is built for that second job. It uses Google PageSpeed Insights for Lighthouse lab data and surfaces CrUX field data when PSI returns it. That is not the same engine as GTmetrix’s real-browser test. Agencies already keep peers on the same shelf: PageSpeed Insights for a free public link, WebPageTest for a heavier waterfall when a ticket needs it, DebugBear when the brief is continuous CWV history. If you need observed Chrome from a specific city tonight, keep a diagnostic tool. If you need a dated history across a client portfolio, schedule monitoring.
Side-by-side at a glance
| Capability | GTmetrix (typical) | Apogee Watcher |
|---|---|---|
| Primary job | On-demand / monitored URL diagnostics | Scheduled multi-site CWV / PSI monitoring |
| Browser engine | Real Chrome (observed) | PSI Lighthouse lab (+ CrUX when available) |
| Test locations | Many global servers | Via Google PSI infrastructure |
| Multi-organisation | No (flat / limited seats) | Yes |
| Page discovery | Manual URLs | Sitemap + HTML crawl |
| Team roles | Limited seats on higher plans | Admin / Manager / Viewer per org |
| Reports | PDF; white-label on Agency | PDF; white-label on Professional+ |
| Free entry | Free manual tests / Lite entry | Free domain check at /check |
Capability summary for orientation. Confirm current GTmetrix plan details on gtmetrix.com/pricing and Watcher plans on apogeewatcher.com/pricing. Verified: 13 Nov 2026.
Who this site is for
Technical leads and performance-minded account managers who already know GTmetrix (or PageSpeed Insights) and are tired of treating every client homepage as a weekly homework assignment. If you only test one site occasionally, you may not need a monitoring product at all. If you bill for ongoing performance care, you need dates, baselines, and a place clients can look without editing your URL list.
How to use these pages
Start with the comparison if you are deciding between diagnostics and schedules. Use the agency and onboarding pages when the pain is operational. Use the LCP, INP, and CLS pages when the conversation is metric-specific. The free domain check is the lowest-friction way to see Watcher’s report shape on a real host before you change tools.